

Introduction
There are some projects where data may play an important part and hence the elicitation of data requirements and understanding the techniques to use as a result are necessary.
This article aims to cover these techniques and to provide a guide of how to use them.
Examples of data centric projects could include:
- Bringing data together into one central location from various other data sources and / or including data from third parties such as outsourcers
- A new system holding new data currently stored elsewhere
- Reporting needed
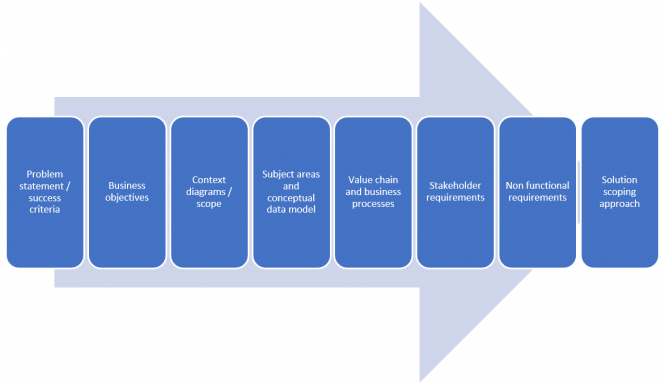
There are various solution options to be explored but it is important to follow several steps first before the solution scoping approach stage.
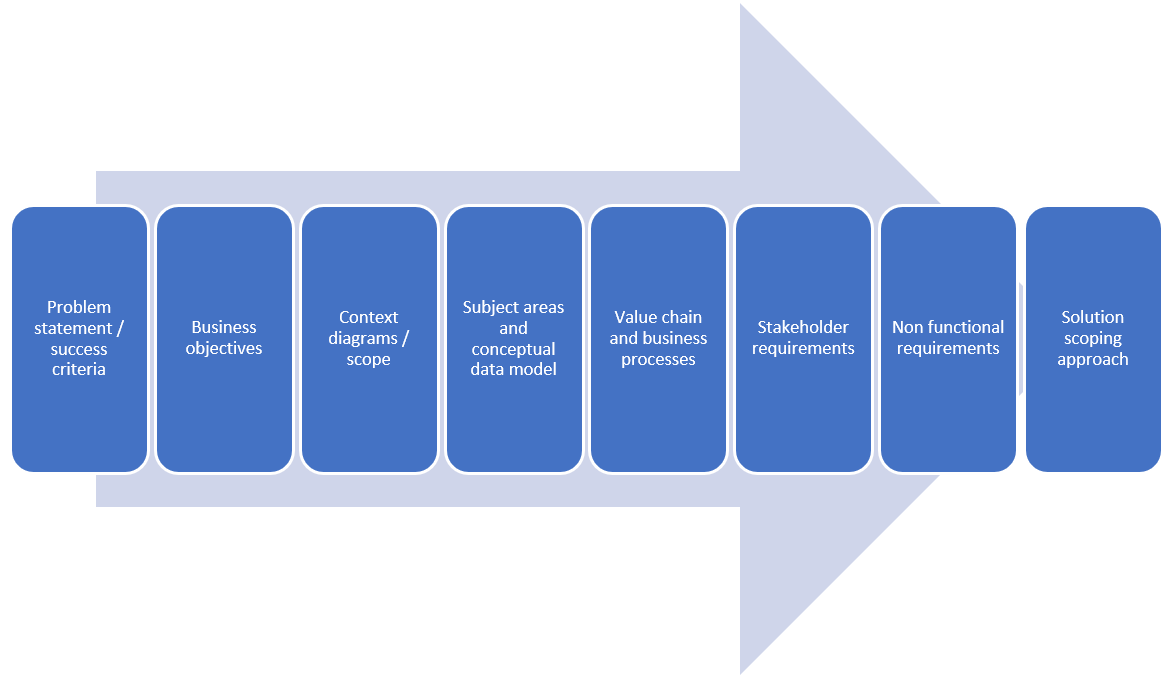
Problem statement / success criteria
Understanding the problems the new data solution hopes to address is an essential first step. It is important to understand this and the success criteria. It would be difficult to understand whether the solution is likely to be a success without having this to measure back to. It is important to understand all the stakeholders impacted to ensure that all the viewpoints are considered to understand the problems to be overcome.
A problem statement should include the problem, an understanding of the impact, who it affects and what success would look like.
Typical problems maybe around not able to analyse data effectively, cumbersome processes or lack of reliability.
Business objectives
Understanding the business objectives are important to understanding and agreeing the scope. If these are not agreed, then there is a risk of the project becoming never ending. It is also important to understand the priority of the business objectives as on very large data projects there may be a need to break the project down into phases for it to be achievable. For example, if integrating lots of legacy systems together to a central location there may be a need to phase the different systems or alternatively to work on the data subject area in chunks.
Context Diagrams / scope
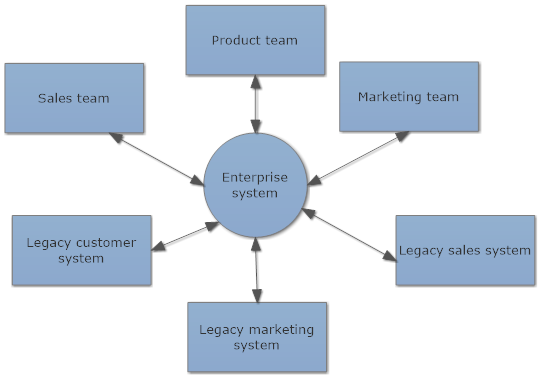
Context diagrams are a fantastic tool for also ensuring the scope is fully recognised. It is a simple diagram which will show on one page all the human and system interfaces relating to the new solution. It is a great way of checking with all the business stakeholders and architects that no interface has been missed.
In the example below the new system in scope is about centralising data from legacy systems into one place. This ensures all the related systems are shown and teams that need to be involved.
Subject areas and conceptual data model
This would normally involve getting the stakeholder in a workshop to identify all the main subject areas for consideration and explaining the relationships between the types of data. Sometimes a collection of forms / reports manually prepared by various teams is a good starting point to understand required conceptual data model.
Alternatively, there could be bottom up analysis by looking at the data in the existing systems.
Because this is conceptual it doesn’t matter how the data is physically shown but how it logically connects.
If the objective of the project is to collate several systems together containing similar data, then they may already have completely different structures which could be confusing with the bottom up approach. In this circumstance the workshop approach may be better or at least done in conjunction with each other.
Understanding how the data is going to be used is also important as legacy systems could hold data no longer used. The workshop approach is also useful as it may uncover new data to be collated, isn’t bound by as many restrictions and enables discussion and consensus on what data has the highest priority and how it needs to be used in the future.
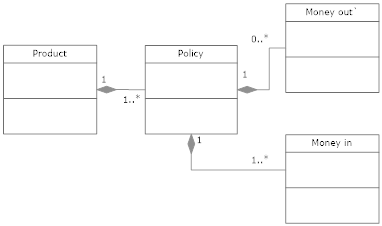
The diagram above shows a conceptual model using class model notation. It highlights how the different types of data relate to each other.
Above shows:
- A product for an insurance company can be related to one of more policies
- A policy can be related to only one product.
- A policy can have zero to many instances of money being paid out.
- An instance of money being paid out can only be related to one policy.
- A policy can have one or more instances of money going in.
- An instance of money being paid in can only be against one policy.
This starts to build a picture of how the data needs to be related to each other and generates a discussion on whether the relationships are correct. For example, the company may have a requirement to group money out to save on bank transaction charges. This would change the conceptual model above slightly and shows how requirements could have been missed without discussing these relationships.
To build the conceptual model further any data requirements that have a one to one relationship is likely to be an attribute and belong to the same subject area or if there is a one to many then a new subject area may be required. A many to many relationship often indicates a subject area is missing. The addition of attributes turns the conceptual model into a logical one.
Depending upon the syntax being used the subject area is known as entity classes in UML methodology. The shaded diamond is called a composite relationship and symbolises there is a strong relationship between the entity classes and you can not have one without the other. If the diamond was unshaded then it is called aggregation and has a weak relationship.
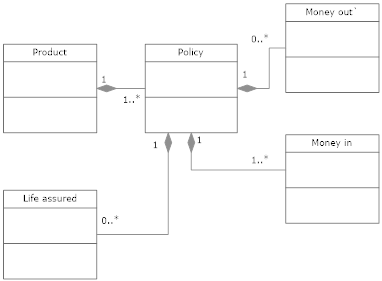
The example above shows that life assured has been added.
This means
- A policy can have zero or more life assured associated with it.
- A life assured is related to a policy.
Business Processes
Analysing the different processes at each stage of the value chain is required to understand how the data might need to be used at each stage. See below for an example. This will demonstrate the processes requiring front end or reporting functionality. It is unlikely to have data requirements without functionality being required to insert, update, delete or report on the data.
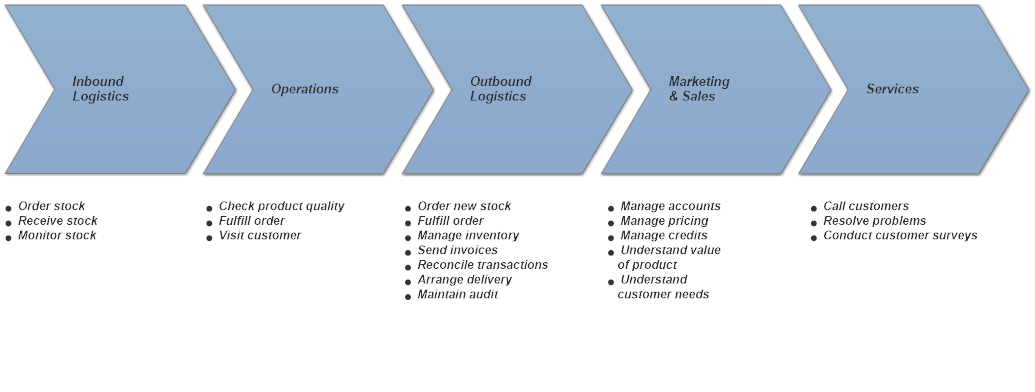
See a guide for business process modelling for any further guidance on modelling business processes. It is worth analysing the “to be” business processes to ensure the requirements are built on improved processes rather than possible outdated duplicated processes.
Another technique is a matrix to show the relationship between the processes, the stages of the value chain and the types of data.
Stakeholder requirements
This is where the stakeholder requirements can now be written once the understanding of the previous stages have been identified. It is helpful to split out the stakeholder requirements into sections depending upon the required audience. Requirements should relate back to the problems, success criteria, objectives and processes identified. As per standard requirement documents each requirement should be challenged and prioritised depending upon how the value it gives and the urgency. See the article the hierarchy of requirements for an overview of stakeholder requirements.
Non-Functional requirements
It is important to also collate non-functional requirements prior to solution evaluation. This will help identify how sophisticated the solution will need to be, the volumes it needs to be able to handle, future capacity, number of users etc. For further information on non-functional requirements click here.
Conclusion
This article is based on my experience in a recent large data warehousing project and from reading Vicki McCracken’s book, Requirements for an MDM solution. These steps are a proven methodology for these types of projects and her book goes into further detail of the solution scoping approach.
It is important to go through these stages prior to proceeding with the software selection process.
Thoughts? Questions? Please share in the comments.
If you have found this article useful then you might like my book – The Business Analysis Handbook – Techniques and Questions for better Business Outcomes. The book is available from www.koganpage.com and all major print and e-book retailers.
You may wish to review the choice of relationship types shown between classes in the class diagram that you’ve used as an example. Composite is probably the wrong choice for the classes concerned. Consider ‘association’ or where the cardinality is obvious (which it probably is here) then ‘multiplicity’.
Hi Nigel, thanks for your feedback. I chose composite because I wanted to show there was a strong link between the classes. Agree could have chosen association or multiplicity.
Regards, Helen